
Our Formatting Tools Bundle
Table Builder - Graph Maker - Results Reporter - Template Pack
From messy output to polished presentation
A practical bundle for psychology and social science students who want cleaner APA-style tables, graphs, and results write-ups with less formatting hassle. Includes the APA Style Table Builder, APA Graph Maker, Results Reporter, and Word Template Pack.
The Tools you’ll Get
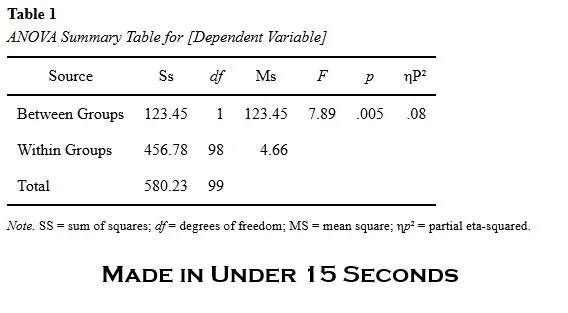
Table Builder
Create clean APA-style tables for psychology and social science work. Paste tab-separated data, apply a template if you need one, then copy or download the finished table for Word.
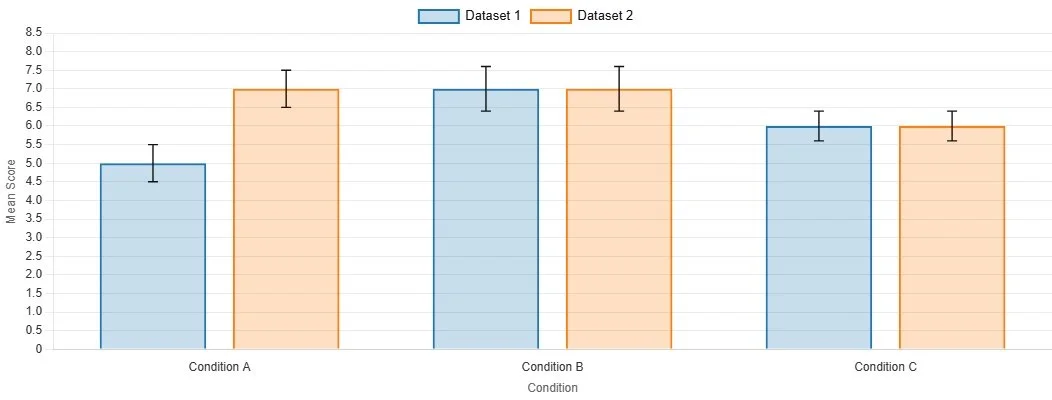
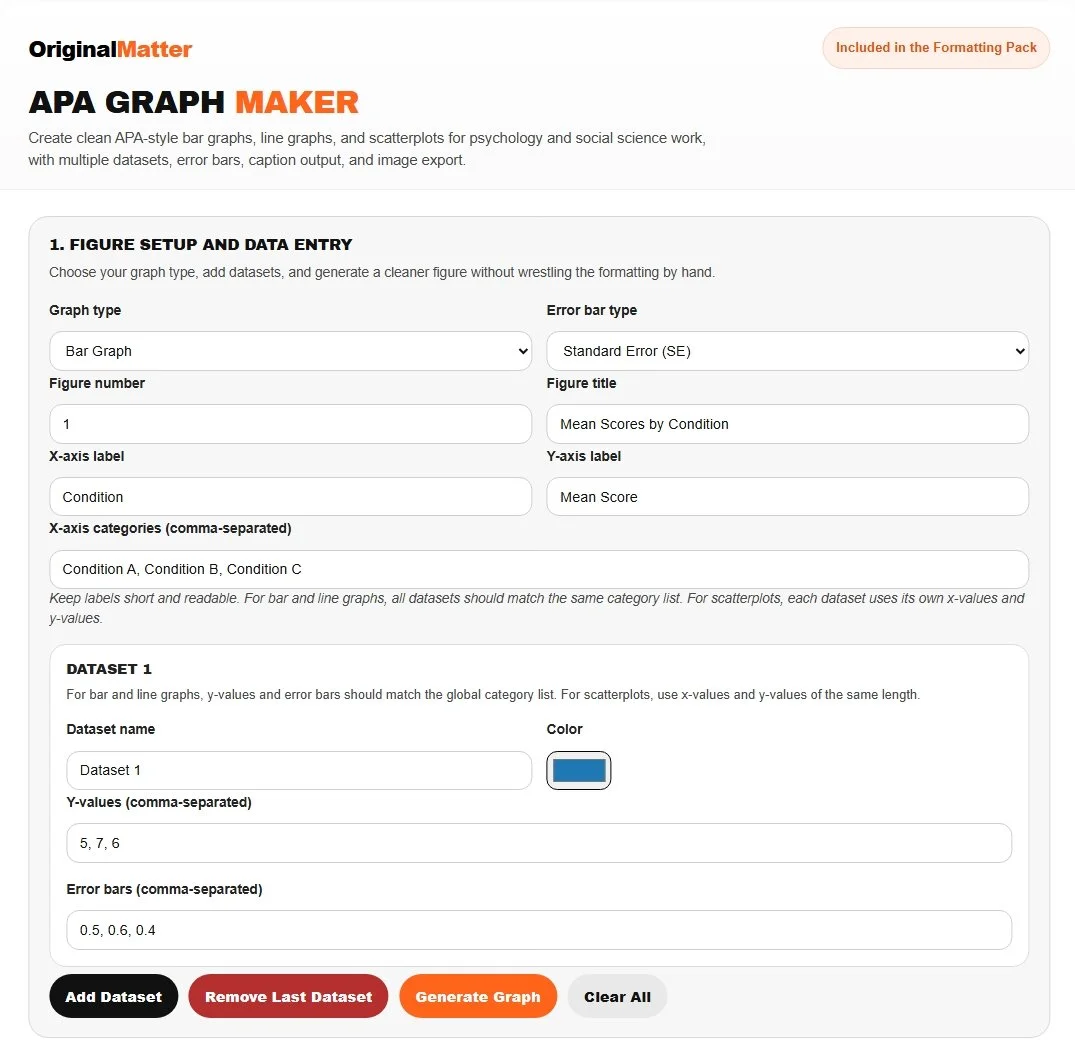
Graph Maker
Create clean APA-style bar graphs, line graphs, and scatterplots for psychology and social science work, with multiple datasets, error bars, caption output, and image export.

Results Reporter
Generate cleaner APA-style results sentences for common statistical tests in psychology and social science work, without wading through a shapeless pile of irrelevant fields first.

Template Pack
A set of ready-to-use APA 7 Word templates for psychology and social science assignments. Built to save time on formatting, structure, and all the low-level document faff that tends to pile up around essays, reports, and dissertations.
Case Study
Meet Maya
Second Year Psychology StudentMaya had the results, but not the time to wrestle Excel into an APA-ready figure. Her graph still needed cleaner labels, error bars, spacing, and a lot of fiddly formatting.
With the Original Matter APA Graph Maker, she entered her data, generated a cleaner chart, and moved straight back to writing.
Instead of losing time to graph cleanup, Maya got a figure that looked clearer, more polished, and one step closer to being submission-ready.
Cleaner tables, better graphs, less formatting pain
Frequently Asked Questions
-
The Formatting Pack includes the APA Table Builder, APA Graph Maker, APA Results Reporter, and Word Template Pack.
-
It is built for psychology and social science students and educators who want cleaner tables, graphs, and results write-ups without wasting time on manual formatting.
-
No. The Formatting Pack is a one-time purchase.
-
Yes. The tools are designed to help you create work that is easier to copy, export, and use in assignments, though you should always check the final output before submitting.
-
No. The pack is designed to make formatting and presentation easier, even if you are not especially confident with the technical side yet.