
Why Is My Result Not Significant? 7 Reasons Your Statistics Refused to Cooperate
There is a specific kind of panic that arrives when you run the analysis, stare at the output, and realise your p-value has wandered off to somewhere safely above .05. At that point, a lot of students start behaving as though the study has failed, the theory has collapsed, and statistics itself has developed a personal grudge. This is usually premature. A non-significant result does not automatically mean there is no effect, your idea was stupid, or the whole project is worthless. The American Statistical Association has been unusually clear on this broader point: scientific conclusions should not rest only on whether a p-value crosses a threshold, and p-values do not tell you the probability that your hypothesis is true. Mehler and colleagues make a similar point for psychology specifically, arguing that a non-significant finding alone is not evidence for the absence of an effect.
That matters because student research often treats “not significant” as a verdict when it is really just a result. Sometimes the effect is genuinely absent. Sometimes it is smaller than expected. Sometimes the study is underpowered, the data are noisy, the assumptions are off, or the test was never a good fit in the first place. In other words, the numbers are often telling you something useful. They are just not always telling you the dramatic thing you hoped for.
TL;DR
A non-significant result usually means one of two broad things: either there really is little or no effect to detect, or your study was not well positioned to detect the effect that might be there. The job is to work out which kind of problem you have before you start rewriting your theory, apologising to your lecturer, or inventing a heroic narrative about “trends.” Power, effect size, assumptions, test choice, measurement quality, and confidence intervals all matter here.
First, what “not significant” actually means
A p-value above your chosen alpha threshold means the data are not strong enough, under that model, to clear the line you set for statistical significance. It does not mean the null hypothesis has been proven true. It does not mean the effect size is zero. It does not mean the theory is dead and buried under the lab floor. The ASA statement explicitly warns against treating p-values as the probability that a hypothesis is true, and against basing conclusions only on whether a threshold was crossed.
That sounds obvious until you watch people react to a p-value of .051 as though they have discovered cosmic injustice. The problem is not just that students misunderstand this. Entire literatures have a habit of treating non-significant findings as invisible or worthless, which is part of why publication bias and the file-drawer problem keep distorting what the evidence base appears to say.
1. Your sample may simply be too small
This is the most common culprit and also the least glamorous. Small samples have low power, which means they are bad at detecting anything except fairly large effects. UCLA’s power analysis guide is blunt about this: small samples have low power, give you fewer suitable statistical options, and can make it harder to evaluate assumptions properly. It also notes that common recommendations for power usually fall around .80 to .90. If your study is underpowered, a real effect can stroll right past your analysis without being caught.
This is why “but I had 24 participants” is not a defence in itself. Twenty-four may be enough for one design and hopeless for another. If the effect is modest and the sample is small, a non-significant result may be telling you less about the theory than about the study’s ability to detect it in the first place.
2. The effect may be smaller than you hoped
Students often build their expectations around big, textbook-friendly effects. Real data is rarely that accommodating. A study can be perfectly respectable and still be chasing a small effect that needs a larger sample or more precise measures to show up clearly. The ASA’s guidance stresses that statistical significance does not measure the size or importance of an effect, and Sullivan and Feinn make the same point more directly: a p-value can suggest whether an effect is detectable, but it does not tell you how large that effect is.
This is where effect sizes start earning their keep. A non-significant result with a small estimated effect may simply mean there is not much there. A non-significant result with a larger estimated effect may instead suggest imprecision, low power, or both. Which brings us to the next issue.
3. Your data may be too noisy
Even when the underlying idea is fine, messy data can flatten your statistical hopes with grim efficiency. High variability makes it harder to distinguish signal from noise. Confidence intervals are useful here because they show the range of plausible population values suggested by the sample and give you a feel for precision rather than just a yes-or-no significance verdict. The National Library of Medicine’s guide notes that confidence intervals indicate the consistency or variability of a result and show the range of values you would expect the true estimate to fall between if the study were repeated many times.
In plainer terms, wide intervals often mean your estimate is wobbly. That wobble can come from noisy measurement, inconsistent responding, a heterogeneous sample, or simply not enough data. Sometimes the result is not significant because the effect is absent. Sometimes it is not significant because your data is shouting over the effect.
4. You may have used the wrong test
This is less rare than students would like to believe. If the analysis does not match the structure of the data or the research question, the output may be technically valid and practically useless. UCLA’s “What statistical analysis should I use?” guide exists for a reason. Different tests are built for different combinations of outcome type, design, and question, and using the wrong one can leave you with a result that never really had a fair chance of meaning anything coherent.
This is also where panic-clicking begins. People remember the name of a test from a lecture slide, decide it feels familiar enough, and then apply it to data that wanted something else entirely. Statistics is not especially forgiving when you confuse “I recognise this test” with “this test fits my design.”
5. Your assumptions may be misbehaving
A lot of student analyses are run as though assumptions are optional bureaucratic paperwork. They are not. UCLA’s power analysis guide notes that the sample size a power analysis gives you assumes the analysis assumptions are met, and its regression diagnostics materials note that assumptions such as homogeneity of variance and normality affect whether p-values and related inference are trustworthy.
This does not mean every slight deviation from normality has murdered your analysis. It does mean that if the assumptions are badly violated, the p-value can become a less reliable guide than students often assume. A result may come back non-significant partly because the model fit is poor, the residuals are behaving badly, or the test was run under conditions it does not handle gracefully.
6. Your manipulation, measure, or design may be weaker than you think
This is the awkward one, because sometimes the problem is not statistical at all. If the intervention was too mild, the measure was too blunt, the categories were too crude, or the design was not sensitive to the thing you actually cared about, the analysis can only work with what it has been given. UCLA’s power guide makes this point indirectly but clearly: power is tied not just to sample size, but to substantive knowledge, design choices, variables, and analysis strategy.
So yes, sometimes the p-value is non-significant because the study never created much opportunity for a detectable difference to emerge. That is not the same as saying the broader idea is false. It may just mean the operational version of the idea was not especially strong.
7. The result may be inconclusive rather than meaningless
This is probably the biggest conceptual mistake students make. A non-significant result often gets interpreted as “nothing happened,” when “we do not have strong enough evidence here” is the more defensible reading. Mehler and colleagues argue that null findings can still be informative, especially when paired with adequate power analysis or methods designed to test whether an effect is absent or negligibly small. The broader point is that non-significant findings are not automatically rubbish. Sometimes they tell you your estimate is imprecise. Sometimes they tell you the likely effect is tiny. Sometimes they tell you the evidence is simply inconclusive.
This is why effect sizes and confidence intervals are far more useful than p-values alone when you are trying to understand what actually happened. Effect sizes tell you about magnitude. Confidence intervals tell you about precision. The p-value tells you whether the evidence cleared one particular threshold under one particular model. Useful, yes. Sufficient on its own, no.
What you should check before you panic
If a result comes back non-significant, there are a few questions worth asking before you start mourning. Was the sample big enough for the effect you expected? Was the effect estimate tiny or just imprecise? Did the descriptive statistics already suggest that the groups or variables were barely separated? Was the test appropriate? Were the assumptions checked? Was the measure good enough to pick up the thing you care about? Those questions usually get you much further than staring at p = .083 and taking it personally.
The real point
A non-significant result is not automatically a dead end. It is often a design-and-interpretation problem in disguise. Sometimes it reveals that the expected effect was overestimated. Sometimes it shows the data are too noisy. Sometimes it exposes weak planning, weak measures, weak test choice, or weak assumptions. Occasionally it really does suggest there is very little going on. But even then, that is still information, which is more than can be said for a lot of last-minute statistical improvisation.
Stop Treating a Non-Significant Result Like the End of the World
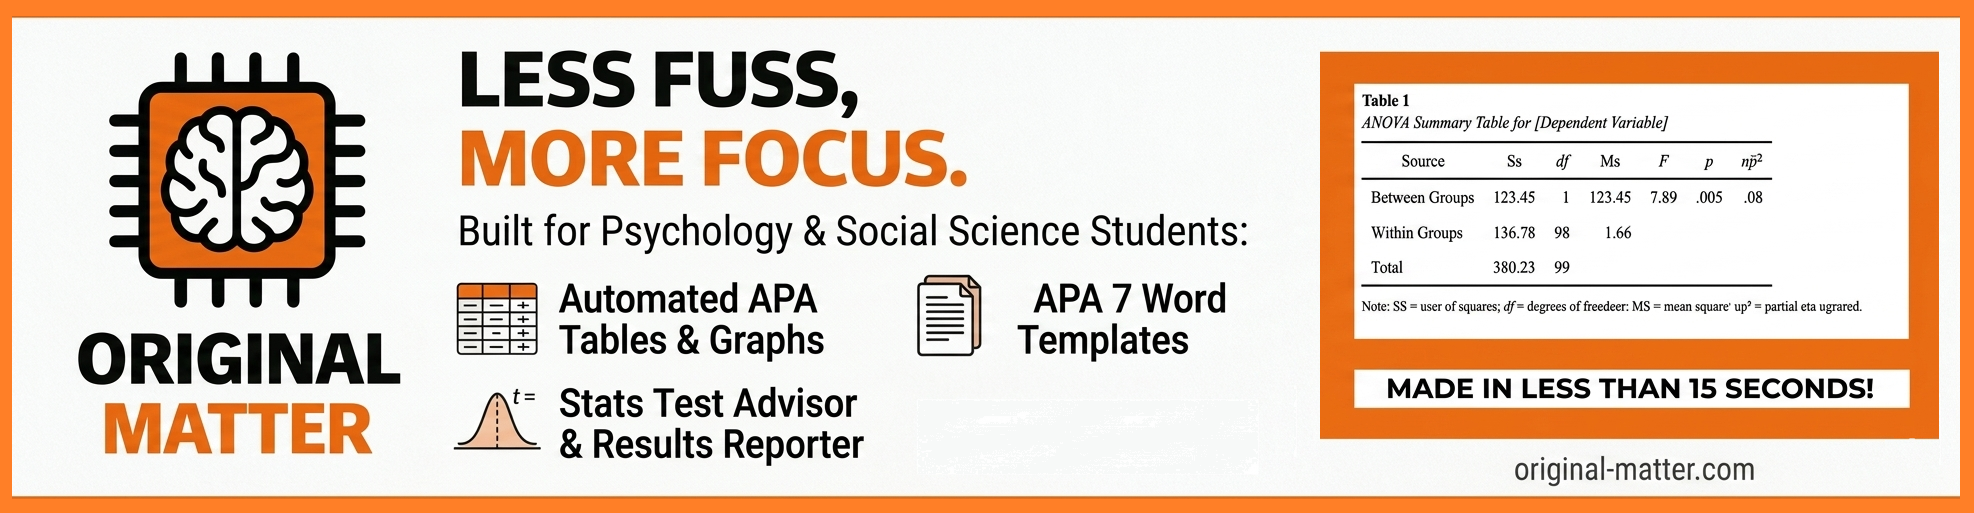
If you are trying to work out whether your result is non-significant because the effect is tiny, the sample is too small, the assumptions are off, or the test choice was wrong from the start, that is exactly the sort of mess the Original Matter Stats Pack is built for. The pack includes the Stats Test Advisor, Descriptive Stats Interpreter, Effect Size + Power Visualizer, Sample Size Calculator, and Regression Assumption Checker, all aimed at helping psychology and social science students make clearer statistical decisions without bouncing between half-helpful guides and rising irritation.
So when the numbers refuse to cooperate, you do not have to rely on vibes, panic, or the one lecture slide you vaguely remember from week six.