
Chi-Square Test of Independence vs Goodness-of-Fit: What’s the Difference?
A lot of students do not really struggle with chi-square itself. They struggle with the moment they realise there is more than one version and the names are just similar enough to become annoying. At that point, statistics starts to feel less like a method and more like a puzzle written by someone who resents clarity.
The good news is that the difference is not especially deep. Both tests belong to the same family. Both work with categorical data. Both compare observed counts with expected counts. The real difference is the question you are asking.
A chi-square goodness-of-fit test asks whether one categorical variable matches an expected pattern.
A chi-square test of independence asks whether two categorical variables are related.
That is the divide. Same family of test, different job.
What the two tests have in common
Before separating them properly, it helps to see what they share. Both tests work with counts in categories, not means, not standard deviations, and not continuous scores pretending to be something they are not. Both ask whether the pattern you observed is far enough away from what you would expect under the null hypothesis to count as statistically significant.
In both cases, the logic is the same at a basic level. If the observed counts look fairly close to expectation, the chi-square value stays small. If the mismatch gets larger, the chi-square statistic rises with it.
So yes, they are closely related. They are just not interchangeable, which is where students usually come unstuck.
What is a chi-square goodness-of-fit test?
A chi-square goodness-of-fit test is used when you have one categorical variable and want to know whether the observed frequencies fit some expected distribution.
That expected pattern might be equal proportions across categories. It might also be a more specific pattern you had reason to expect before you collected the data. The point is the same. You are comparing one observed distribution against one expected distribution.
Imagine you ask ninety students which of three essay topics they would choose. If you expected those choices to be evenly distributed, you would expect about thirty students in each category. If the observed counts come back heavily lopsided, the goodness-of-fit test helps you judge whether that imbalance is large enough to look meaningful rather than random.
The null hypothesis here is about the distribution itself. It says the observed frequencies do not differ significantly from the expected pattern. The alternative says they do.
So if your question is, “Does this one variable follow the pattern I expected?” you are in goodness-of-fit territory.
What is a chi-square test of independence?
A chi-square test of independence is used when you have two categorical variables and want to know whether they are associated.
This time, you are not checking one variable against a preset pattern. You are checking whether the distribution of one variable seems to depend on the other.
Imagine you collect data on year group and preferred assessment type. You want to know whether first-year, second-year, and third-year students differ in what they prefer. That is not a question about one variable matching an expected distribution. It is a question about whether two variables are related.
The null hypothesis here says the variables are independent, which means there is no association between them. The alternative says there is an association.
So if your question is, “Are these two categorical variables related?” you are dealing with a test of independence.
The quickest way to tell them apart
If you want the shortest possible distinction, it is this:
A goodness-of-fit test asks whether one variable follows an expected pattern.
A test of independence asks whether two variables are related.
That is really all you need to keep in view. One variable versus an expected distribution. Two variables versus possible association.
Most of the confusion comes from students staring at a table of numbers and trying to choose the test by atmosphere. Atmosphere is not a recognised statistical method.
A side-by-side example
Suppose you survey 120 students about preferred study format: online, face-to-face, or blended.
If your question is whether students are equally likely to prefer each option, that is a goodness-of-fit problem. You have one categorical variable, study format preference, and an expected pattern of equal proportions.
Now suppose you also collect year group and want to know whether study format preference differs between first years, second years, and third years. That is a test of independence problem. You now have two categorical variables, and the question is whether they are associated.
The data may look similar on the page, which is part of the reason students mix them up. The deciding factor is not that both involve categories. The deciding factor is the question.
What they both assume
Both versions of chi-square come with a few conditions that students sometimes forget because they are too busy being relieved that they are not doing a t-test.
First, the data should be categorical. These are groups or categories such as yes or no, pass or fail, preferred option A, B, or C. If you are comparing average scores on a continuous measure, chi-square is usually not your test.
Second, the data should be in the form of frequencies or counts. Chi-square is built around how many cases fall into each category. Percentages can help you explain the pattern, but the test itself runs on counts.
Third, the observations should be independent. Each case should belong where it belongs without quietly appearing multiple times in a way that muddles the analysis.
Fourth, the expected counts should not be too small. Chi-square works best when the expected frequencies are reasonably sized. Sparse tables can make the test less trustworthy, which is the sort of detail students often discover just after deciding they were finished.
Common student mistakes
The most common mistake is choosing the wrong version of the test because both names begin with “chi-square” and statistics has decided that should be enough guidance for everyone.
Another common problem is using chi-square on data that are not really categorical. If your variable is continuous, such as anxiety score, reaction time, or exam mark, chi-square is usually not the right fit unless you have deliberately turned the scores into categories for a sound reason. Students often do this because the test feels familiar, not because the data actually wants it.
There is also the small but persistent issue of writing the wrong null hypothesis. In a goodness-of-fit test, the null is about whether the observed distribution matches an expected pattern. In a test of independence, the null is about whether two variables are unrelated. Those are different claims. They should not be treated as interchangeable administrative wallpaper.
And then there is the classic expected-count problem. A chi-square result can look wonderfully official while resting on a table that is a bit too thin to trust comfortably.
Which one should you use?
Use a chi-square goodness-of-fit test when you have one categorical variable and want to compare the observed counts with an expected distribution.
Use a chi-square test of independence when you have two categorical variables and want to know whether they are associated.
That is the decision rule. Not glamorous, admittedly, but solid.
If you find yourself trying to decide based on whether the table “looks like” a chi-square problem, step back and ask the real question instead. Are you testing fit, or are you testing association? Once that is clear, the right choice usually becomes much less dramatic.
Final thought
The difference between chi-square goodness-of-fit and chi-square independence is not some hidden statistical secret. It is just a question of what you are trying to find out.
Are you checking whether one categorical variable follows an expected pattern?
Or are you checking whether two categorical variables are related?
Once that distinction clicks, the rest becomes much easier. Which is fortunate, because statistics already has more than enough unnecessary theatre.
Stop Guessing Which Chi-Square Test You Need
If you have ever looked at a categorical dataset and wondered whether this is a goodness-of-fit problem, an independence problem, or a sign that you should have had more sleep, that is exactly the sort of problem the Original Matter Chi-Squared Calculator and Stats Test Advisor are built to help with.
The Stats Test Advisor helps psychology and social science students work out which test fits the question in front of them. The Chi-Squared Calculator then helps organise counts, clarify the structure of the result, and move toward a cleaner APA-style write-up without having to manually wrestle every step into place.
Because once you have finally worked out what your data is asking for, the last thing you need is to lose another half hour to a test choice that should have been simpler than this.
Our Calculator In Action
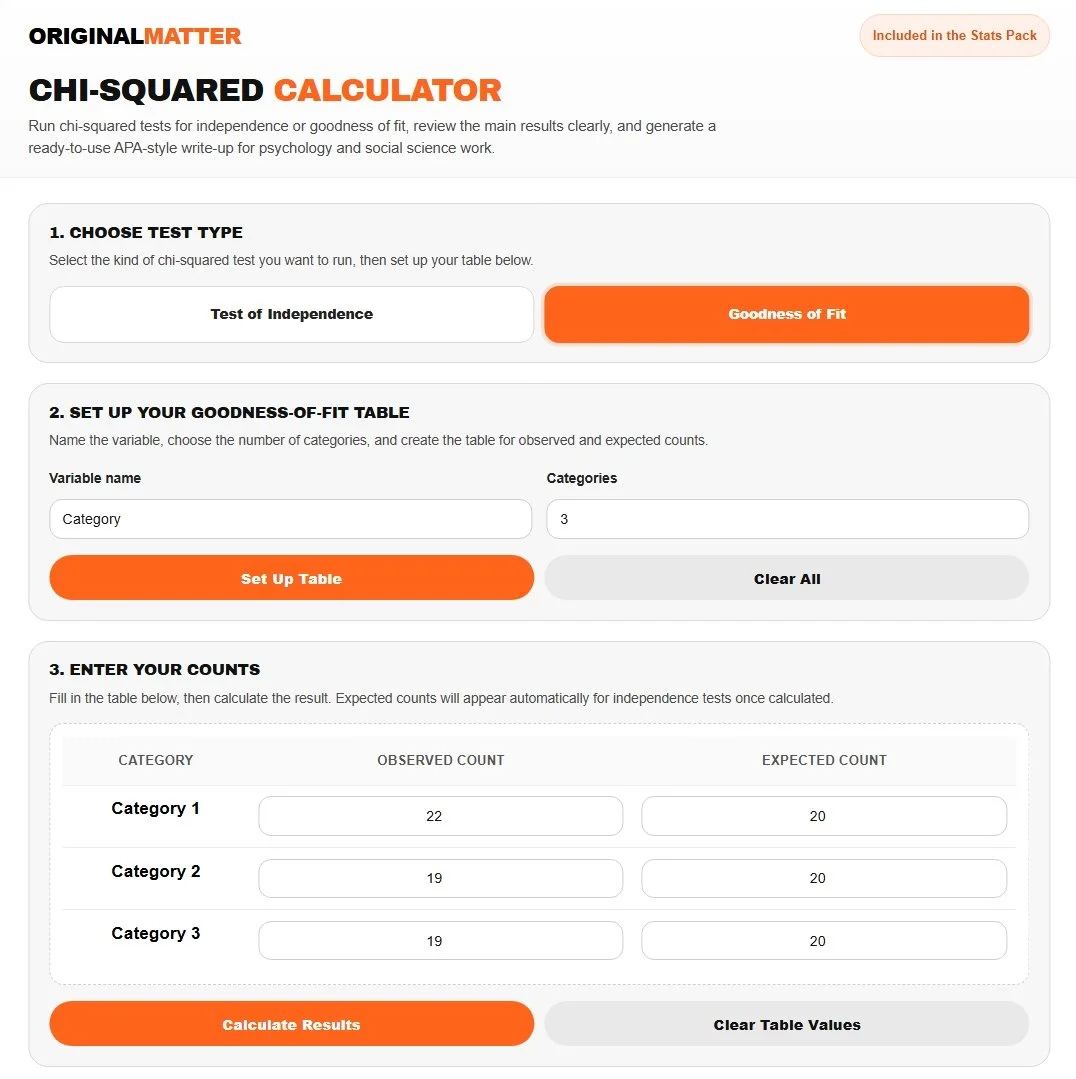
Let’s see if a six-sided die is weighted. In this case, we roll a die 60 times, then use three categories to represent rolling a 1 or 2, a 3 or 4, and a 5 or 6. If the die is fair, each category should have the same count.
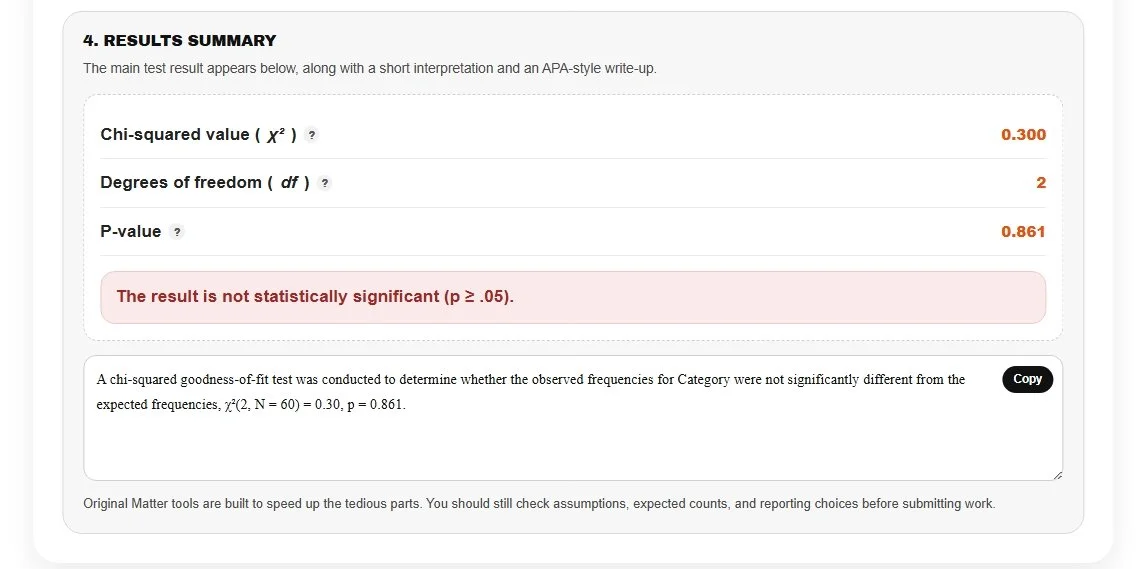
Because your p-value (0.861) is well above .05, you fail to reject the null hypothesis. In plain terms, the observed counts do not differ significantly from what you would expect from a fair die, and you now have a ready-to-use APA-style write-up!
References
Agresti, A. (2018). An introduction to categorical data analysis (3rd ed.). Wiley.
Field, A. (2018). Discovering statistics using IBM SPSS statistics (5th ed.). Sage.
McHugh, M. L. (2013). The chi-square test of independence. Biochemia Medica, 23(2), 143-149.
Pennsylvania State University. (n.d.). Chi-square tests. STAT 200.
Pennsylvania State University. (n.d.). Chi-square goodness-of-fit tests. STAT 415.
Pennsylvania State University. (n.d.). Chi-square test for independence. STAT 500.